

The US Dollar has been in a weird trading zone since the contradicting NFP report from the beginning of the month (forcing a dovish hand) and the strong PPI report that has shown the appearance of tariff effects (forcing a hawkish hand).
Since, the odds for a September cut have held tight, despite regressing slightly (was up to 97% before the PPI report but re-corrected back to around 87% currently).
The confusion stands from a FED Chair having changed his tone at his Jackson Hole speech last Friday, which tends to be considered a pre-emptive sign of a cut approaching sooner than later.
However, Market reactions may have been exaggerated for the little advances he mentioned towards a larger Sep cut or even a prolonged/fast-pace cut cycle.
Hence, the US Dollar caved on the Friday session before rebounding yesterday.
The past two weeks of Forex trading have pretty much dawdled around with no direction found – The September Cut is almost a sure thing by now, particularly after US President Trump fired another Federal Reserve governor Lisa Cook, who was appointed by President Biden in 2022.
But these questions remains:
How much can the FED really cut to avoid inflation coming back?
Inflation expectations are high and the warning from PPI wasn’t one to neglect.
Is it already too late to prevent a Job market harsh slowdown?
The previous Non-Farm Payrolls report was a scary one, with job creation already slowing down (despite demand also slowing down). The next one is coming up on September 5th.
Dollar Index multi-timeframe Analysis
US Dollar Daily Chart
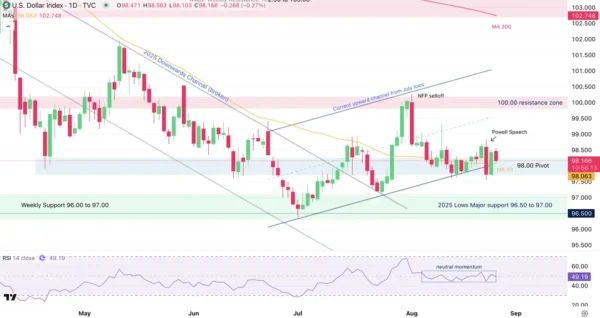
Dollar Index (DXY) Daily Chart, August 26, 2025 – Source: TradingView
The Greenback has been held in a 1000 pip consolidation since the past 10 sessions.
One would have thought that it was the end for the USD after Friday’s reactions to Powell, but as explained in the introduction, it seems that Markets have backed up on their Friday ecstatic reactions – This can be seen in Cryptos and Equities not continuing their up-moves and even retracting.
Consolidating around the 98.00 Pivot, a key milestone for the current trading, Markets will await further data to try to find direction.
Look at how flat the RSI has been since the 13th of August.
US Dollar 4H Chart

Dollar Index (DXY) 4H Chart, August 26, 2025 – Source: TradingView
The US Dollar is still holding its low-slope ascending channel despite having reasons to break out from it.
As seen on the chart, the DXY is held between 98.80 range highs and 97.60 range lows, with the 50-period MA just holding in the middle of the range (98.17)
The narrative would imply downward movement to the USD but the move may have happened throughout the first part of 2025! In case you forgot, the DXY was at 110.00 just in January.
So that leaves the overall direction subject to change, where data slowing down the extent of cuts pricing in would make the US Dollar rebound.
Levels of interest for the Dollar Index:
Support Levels:
- 50-period MA acting as immediate support (98.17)
- Lower bound of the upward channel and low of 98.00 pivot zone (97.60)
- 2025 Lows Major support 96.50 to 97.00
Resistance Levels:
- US Dollar range Highs 98.82
- Mid-line of the ascending channel and psychological level 99.50
- 100.00 Main resistance zone
You may expect further consolidation in FX and other markets in the waiting of more data (Core PCE is approaching on Friday).
Safe Trades!