

Since last Friday’s Non-Farm Payrolls number, the Greenback has been getting obliterated, retreating from the 100.00 landmark in the DXY to touching high 97.00 levels.
Markets are quickly moving towards a heavy pricing of FED cuts which is hurting the Dollar and supporting strongly Equities in their ongoing rebound.
It will be essential to see how US indices open today but the trading has been green for other global indices, particularly the DAX up 1.70% on the session, and the Nasdaq (CFD and Futures) is about 200 points from its all-time highs.
In the meantime, the US Dollar follows through with another beginning of NA session where it lags other majors and even bringing back USDCAD back into its past months’ range, despite an also underperforming Loonie (which you can check out right here)
To continue yesterday’s Mid-Week analysis, we’ll review the Dollar Index in detail and a few pairs.
Will the USD downfall continue?
Dollar Index Multi-Timeframe Analysis
Dollar Index Daily Chart
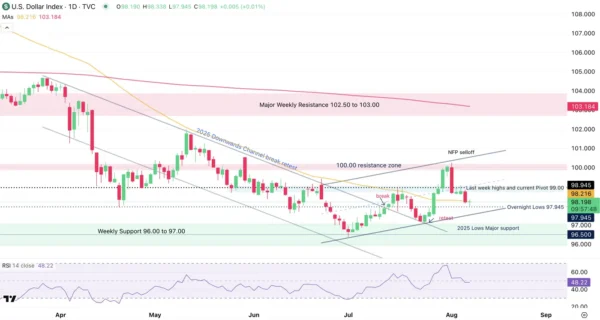
US Dollar Index Daily Chart, August 7, 2025 – Source: TradingView
The outlook for the US Dollar is neither bullish or bearish looking at the daily chart.
The swift End-July rebound could have brought the greenback towards a more tenace Bull outlook but the strong NFP retracement corrected that thesis.
This is another proof of how stong psychological levels (100.00 Level resistance) can be – despite them overshooting slightly on some occasions – and how influential data like Non-Farm Payrolls can be.
The Daily RSI flattening at the middle line indicates higher probability of rangebound action for Major FX pairs as Markets await for more key data.
The Dollar is trading right at its 50-Day MA so watch where Markets take the index from here.
Dollar Index 4H Chart
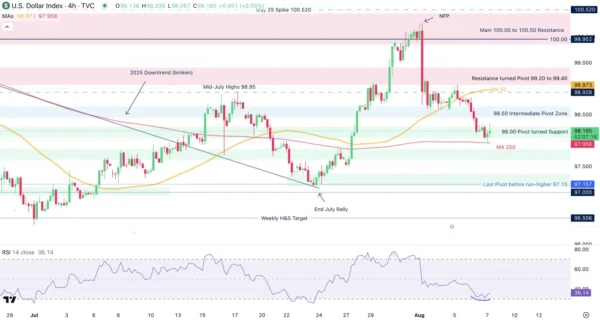
US Dollar Index 4H Chart, August 7, 2025 – Source: TradingView
Looking closer, we see that the overnight selloff in the Dollar has found support at just below the 98.00 handle, just below its support zone (overnight lows: 97.45).
The swift retreat downwards found supporting buyers at the 4H MA 200 which will be a key mark to follow for upcoming trading.
After this morning’s Bank of England Cut, markets may be realizing that the US Main rates are still high (currently 4.50%) which could lead to some consolidation in the Index int he waiting of further data.
Levels to watch for the Index:
Support Levels:
- 98.00 Pivot turned Support
- 4H MA 200 97.60
- Last Main low Pivot 97.15
Resistance Levels:
- 98.50 Intermediate Pivot Zone
- Resistance turned Pivot 99.20 to 99.40
- 100.00 to 101.00 Main Resistance
Dollar Index intraday – 30m Chart
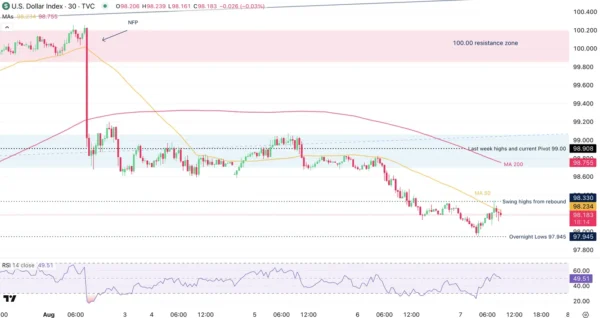
US Dollar Index 30m Chart, August 7, 2025 – Source: TradingView
For immediate Bull/Bear strength analysis, watch the overnight lows (97.95) and the current swing highs (98.30) – If markets close above on strong candles, expect continuation.
If the DXY gets choppy from here, look at individual pairs which may offer decent rangebound setups.
Safe Trades!