

The US stock market reopened on Tuesday, 2 September, with a weak start after the Labour Day holiday. All four major benchmarks tumbled between –1.3% and –1.8% in the first half of the session, pressured by fears of a global liquidity squeeze following a sharp spike in the UK’s 30-year gilt yield to 5.69%, it’s highest in 27 years, amid concerns over government budget risks.
However, losses eased later in the session. The small-cap Russell 2000 outperformed, closing flat, while the S&P 500, Nasdaq 100, and Dow Jones pared earlier declines to finish down –0.7%, –0.8%, and –0.5%, respectively.
Incoming Fed dovish pivot provides a liquidity backstop with a bull steepener
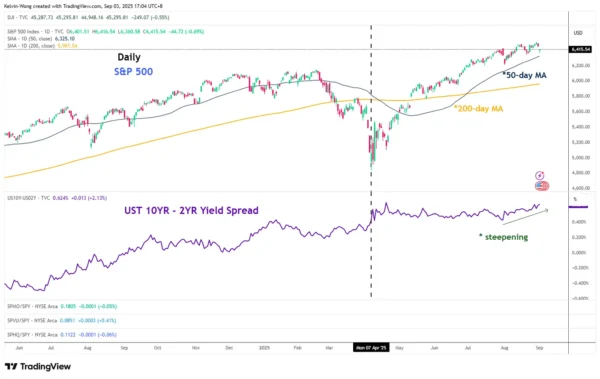
Fig. 1: SPX 500 major trend with US Treasury yield curve (10-YR minus 2-YR) as of 2 Sep 2025 (Source: TradingView)
The intraday rebound in US equities was likely driven by rising expectations of a Fed dovish pivot at the upcoming FOMC meeting on 17 September. According to the CME FedWatch Tool, Fed Funds futures now price in a 91% probability of a 25-bps rate cut to 4.00%–4.25%, up from 89% a week earlier.
Hence, the 2-year US Treasury yield, which is sensitive to the changes in the monetary policy stances of the Fed, rose by 2 bps yesterday, which is less than the 3 bps increase seen in the 10-year US Treasury yield
Stretching it out over a longer-term horizon, the 2-year US Treasury yield has fallen by 15 bps from 21 August 2025 to Tuesday, 2 September 2025, a higher magnitude in comparison to the 10-year US Treasury yield, which only dropped by 7 bps.
This observation seen on the US Treasury yield curve (10-year minus 2-year) is called a bull steepener, where short-term interest rates fall faster than long-term rates, widening the spread between them.
It tends to be bullish for the US stock market at least in the medium-term, as the liquidity infusion from the Fed can be used to negate the adverse effects of the US White House trade tariffs policies (see Fig. 1).
Let’s now take a deep dive into the short-term directional bias and key levels to watch on the US SPX CFD Index (a proxy of the S&P 500 E-mini futures) from a technical analysis perspective.
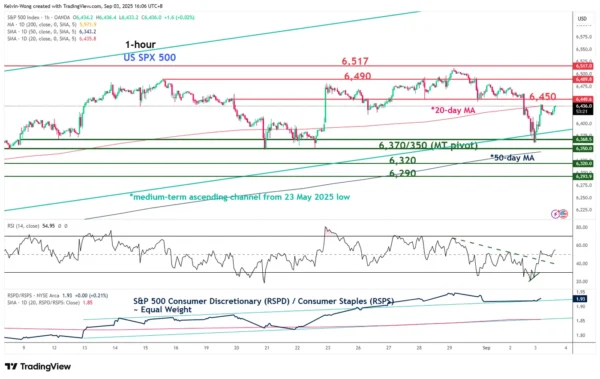
Fig. 2: US SPX 500 CFD Index minor trend as of 3 Sep 2025 (Source: TradingView)
Preferred trend bias (1-3 days)
Yesterday’s sell-off has been overdone. The medium-term uptrend phase of the US SPX 500 remains intact. Bullish bias for a short-term recovery in the first step, watch the 6,370/6,350 key medium-term pivotal support (see Fig. 2).
A clearance above 6,450 intermediate resistance increases the odds of the recovery process for the next intermediate resistances to come in at 6,490 and 6,517 (close to the current all-time high level of 6,513 and a Fibonacci extension cluster).
Key elements
- Yesterday’s sell-off seen in the US SPX CFD Index has managed to stall at the lower boundary of a medium-term ascending channel in place since the 23 May 2025 low.
- The hourly RSI momentum indicator of the US SPX CFD Index has flashed a bullish divergence condition at its oversold condition and staged a bullish breakout from a parallel descending resistance.
- The higher beta equal-weighted S&P 500 Consumer Discretionary sector ETF has continued to outperform the defensive-oriented equal-weighted S&P 500 Consumer Staples sector ETF (see Fig. 2). This observation supports a bullish reversal scenario in the US SPX 500 CFD Index.
Alternative trend bias (1 to 3 days)
Failure to hold at the 6,370/350 key medium-term support on the US SPX 500 CFD Index jeopardises its medium-term uptrend phase to expose the next intermediate supports at 6,320 and 6,290 in the first step.