The most recent moves in the US Dollar may have mean-reverted in Forex markets, but the same can’t be said about precious metals.
They had been subject to some selling pressure ahead of the Jackson Hole Symposium but a conjunction of a dovish interpretation of FED Chair Jerome Powell’s speech and growing concerns about the Federal Reserve’s independance have brought demand back.
A former Board member of the FED (able to vote at every FOMC meeting), Lisa Cook has recently been fired by President Trump “For cause” – She had been appointed by President Biden in 2022 and has been dissenting for rate cuts; but the reasoning has been valid with the growing inflation concerns from tariffs. (PPI just came in at 0.9% vs 0.2% m/m for those who have forgot).
A former FED governor Lael Brainard expressed her fears concerning this attack on the Federal Reserve’s Independence.
However, this has helped metals to come back on the front-scene: Since marking lows on the last trading day of July, Silver is up 6% and saw another leg higher after last Friday’s speech.
Since, the metal has been consolidating at its relative highs, a sign that usually helps for pursued upside.
Let’s take a look at the charts for Silver (XAG) to spot breakout points and key technical levels.
Metals Daily performance
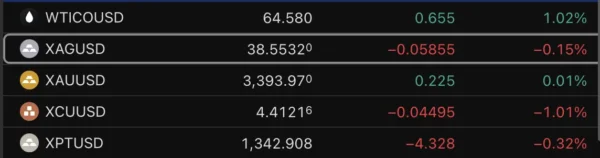
A look at the daily performance in Metals, August 27, 2025 – Source: TradingView XAG = Silver, XAU = Gold, XCU = Copper, XPT = Platinum
Metals aren’t shining too bright in today’s session, however they are holding strong.
Most commonly traded Metals performance in August 2025
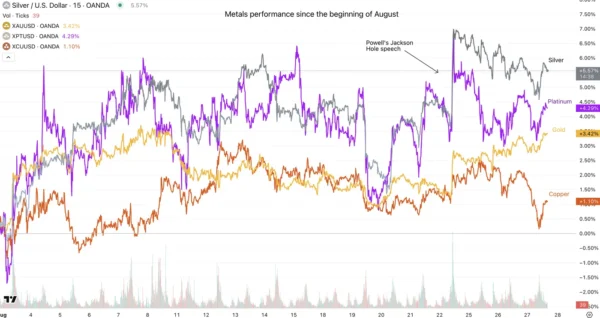
Metals comparative performance since the past month, August 2025 – Source: TradingView
Silver Daily and intraday technical analysis
Silver Daily Chart
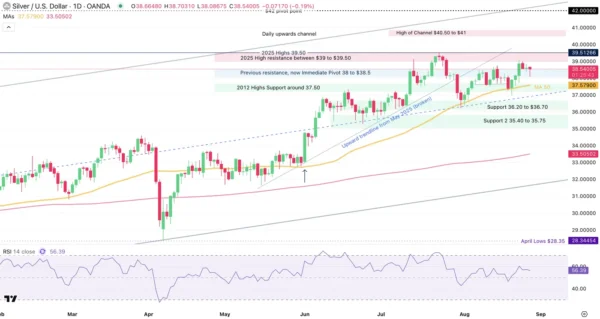
Silver Daily Chart, August 27, 2025 – Source: TradingView
Since our last analysis for Silver which had noted the formation of a head and shoulders formation, bulls have broken its materialization for the current consolidation.
Holding between the $38 to $38.50 Pivot Zone and the 2025 Resistance highs, Markets seem to be waiting for further news before moving XAG further.
In technical analysis, consolidation at relative highs tend to be good signs for further continuation, particularly as Silver is still evolving within a longer-run upward channel.
Do monitor US Dollar strength and rate expectations for fundamentals invalidating these technicals.
Silver 4H Chart
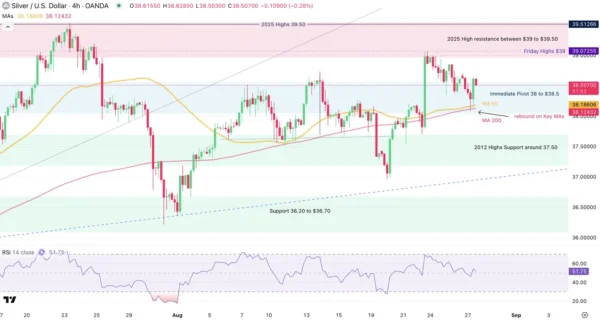
Silver 4H Chart, August 27, 2025 – Source: TradingView
Coming back from overbought levels on the 4H timeframe, Silver is rebounding on both the Pivot Zone and key Moving Averages, which may lead to further upside.
Tomorrow’s US GDP and Friday’s Core PCE will add to volatility quite largely, so keep an eye on these releases.
Breaking the $39 relative highs should confirm further probabilities of new yearly highs being reached – the 2025 highs are at $39.50.
On the other hand, breaching the Key MAs would show more balanced price action ahead.
Levels to watch for Silver (XAG) trading:
Resistance Levels:
- Friday Highs $39
- 2025 High resistance between $39 to $39.50
- 2011 resistance $40 to $41
Support Levels:
- Immediate Pivot 38 to $38.5
- 4H MA 50 and 200 $38.15
- 2012 Highs Support around 37.50
Safe Trades!