

Risk-on sentiment was on full display since the start of this week, as optimism around the US technology boom driven by Artificial Intelligence (AI) once again overshadowed more worrisome global developments on tariffs and growth.
AI optimism triggered another bullish impulsive move on US equities
On Wednesday, 6 August, U.S. equities rallied on news that OpenAI—the creator of ChatGPT and a leading force in the ongoing AI boom—is considering a stock sale that could value the company at $500 billion, a significant leap from its current $300 billion valuation.
Meanwhile, President Trump’s announcement of a proposed 100% tariff on semiconductor imports was largely shrugged off by investors. The impact was softened by incentives: U.S. corporations could be exempt from the levy if they commit to reshoring production. Apple Inc. was cited as a model example.
The S&P 500 and Nasdaq 100 extended their short-term bullish momentum that began on Monday, 4 August, posting intraday gains of 0.7% and 1.3%, respectively. The Dow Jones Industrial Average underperformed slightly with a modest 0.2% gain.
Asian markets followed the positive sentiment today, with bullish momentum persisting. S&P 500 and Nasdaq 100 E-mini futures advanced a further 0.7% by the end of the Asia trading session.
Let’s now decipher the US Nasdaq 100 CFD Index from a technical analysis perspective and construct a medium-term (multi-week) trading set-up.
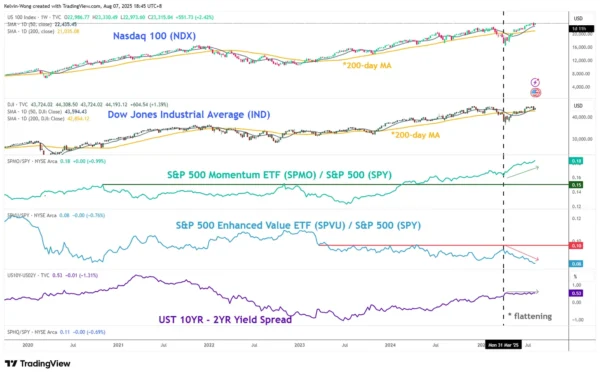
Fig. 1: US Nasdaq 100 CFD Index medium-term trend as of 7 Aug 2025 (Source: TradingView)

Fig. 2: Nasdaq 100 major trend with S&P 500 momentum/S&P 500 relative strength & US Treasury yield curve as of 6 Aug 2025 (Source: TradingView)
Preferred trend bias (1-3 weeks)
The minor corrective decline of -4.4% from 31 July 2025 high to 1 August 2025 low is likely to have ended. The US Nasdaq 100 CFD Index is now in the process of shaping a potential bullish impulsive up move sequence within its medium-term uptrend phase.
Bullish bias with key medium-term pivotal support at 22,945 for the next medium-term resistances to come in at 23,820 and 24,164/24,220 (Fibonacci extension cluster and upper boundary of a medium-term ascending channel in place since 19 June 2025 low) (see Fig. 1).
Key elements
- Price actions of the US Nasdaq 100 CFD Index have reintegrated above and retested the 20-day moving average on Wednesday, 6 August 2025, indicating the potential start of another bullish impulsive up move sequence.
- The 4-hour MACD trend indicator of the US Nasdaq 100 has just trended upwards above its centreline, which suggests the potential start of a new medium-term (multi-week) uptrend phase.
- The S&P 500 Momentum factor exchange-traded fund (ETF) has continued to outperform the S&P 500 ETF since the end of March 2025. Based on past observations, this momentum outperformance has supported the medium-term and major uptrend phases of the US Nasdaq 100 CFD Index (see Fig. 2).
- The US Treasury yield curve (10-year yield of the US Treasury note minus the 2-year yield of the US Treasury note) has flattened since early April 2025. This observation suggests falling US interest rates, which directly increase bond prices and returns in the short run. However, higher bond prices mean lower yields and lower returns for bonds in the future, which in turn, drive investors into the US stock market. An indirect medium-term positive driver to support further potential upside in the US Nasdaq 100 CFD Index (see Fig. 2).
Alternative trend bias (1 to 3 weeks)
Failure to hold the 22,945 key support invalidates the bullish tone to open scope for another corrective decline to expose the next medium-term supports at 22,670 and 22,410 (also close to the 50-day moving average).