

Since our last publication, the EUR/USD has indeed shaped the expected minor bullish breakout above the highlighted 1.1520 short-term pivotal support and hit the 1.1680/1.1705 short-term resistance. It rallied by 1.6% to print an intraday high of 1.1730 on 13 August 2025.
Let’s now examine its latest technical elements to determine its next potential trajectory and key levels.
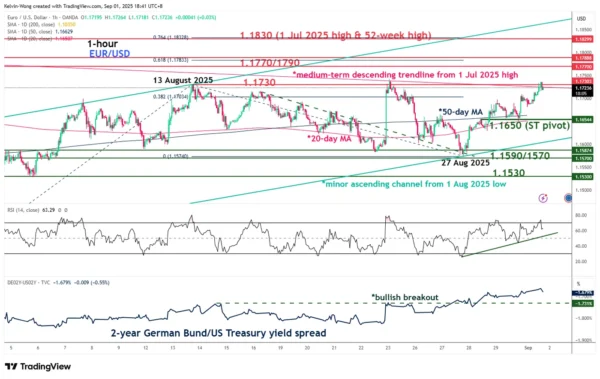
Fig. 1: EUR/USD minor trend as of 1 Sep 2025 (Source: TradingView)
Preferred trend bias (1-3 days)
After shaping a minor corrective range configuration from 13 August 2025 high of 1.1730 to 27 August 2025 low of 1.1574, the EUR/USD is likely to kickstart a potential fresh medium-term bullish impulsive up move sequence.
Bullish bias above 1.1650 key short-term pivotal support. A clearance above 1.1730 intermediate resistance reinforces the bullish tone for the next intermediate resistances to come in at 1.1770/1790 and 1.1830 (also a Fibonacci extension) in the first step.
Key elements
- Price actions of the EUR/USD have started to trade back above its 20-day and 50-day moving averages since last Thursday, 28 August 2025.
- The EUR/USD has oscillated within a minor ascending channel in place since the 1 August 2025 low of 1.1392.
- The hourly RSI momentum indicator has continued to oscillate above a parallel ascending trendline above the 50 level, which short-term bullish momentum is likely intact.
- The yield spread between the 2-year German Bund and the US Treasury note broke higher on Thursday, 28 August, narrowing the differential to –1.68% from –1.82% on 22 August. This development indicates a relative decline in the yield attractiveness of the 2-year US Treasury versus its German counterpart, which in turn exerts downside pressure on the US dollar against the euro.
Alternative trend bias (1 to 3 days)
A break below 1.1650 support negates the bullish tone on the EUR/USD to see another round of minor corrective decline for a retest on the next intermediate support at 1.1590/1.1570 (also the 27 August 2025 swing low area).