

The summer lull appears to be over with September off to a rocking and volatile start for global markets. Stock markets have not started September on the front foot, which isn’t a surprise given that it is a notoriously tricky month for US equity markets.
The US exchanges reopened after the holiday, and nerves rose. Some traders have long felt that stock prices are maybe too high, especially as the economy shows signs of slowing. At the same time, political talk about trade tariffs adds to the doubt, and there are whispers that the Federal Reserve could be feeling pressure from the President.
The tip of the iceberg appeared on Tuesday when new questions surfaced over the weekend about whether the President’s tariffs are even legal. That doubt was enough to push both stocks and bonds down.
Consequently, most market participants expect more swings this week, particularly before Friday’s big NFP jobs report. There remains a possibility that the volatility could simply be a short‑term reaction, not a sign of a deeper problem. The road ahead looks uncertain, and market participants will watch closely.
This is backed up by the Atlanta Fed’s GDPNow model. The model projects that US real GDP will expand at a 3.5% annualized rate in Q3 2025, suggesting steady and robust economic growth.
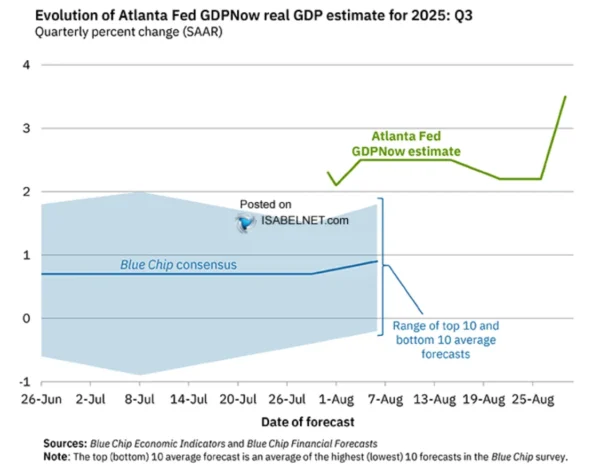
Source: IsabelNet, Blue Chip financial forecasts
The CBOE Market Volatility index .VIX touched its highest mark in over four weeks, while a selloff in the global bond market also raised concern. Benchmark 10-year Treasury yields, which rise when bond prices drop, surged by nearly five basis points to 4.269%, while 30-year yields surged to their highest since mid-July.
When bond yields rise they become more attractive and usually lead to an outflow in equities and a pivot into bonds.
September Seasonal Woes
Historically, September is the worst-performing month for US stocks—this holds true for the past 10 years, 20 years, and going back to 1950. It is rare to see both August and September finish higher in a post-election year.
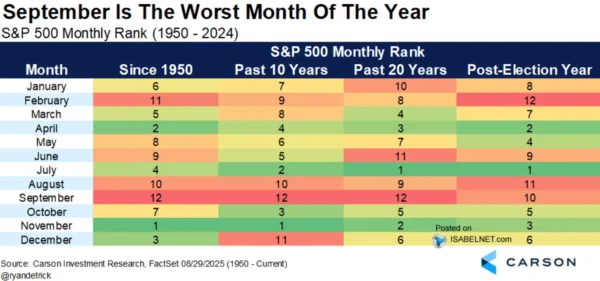
Source: IsabelNet, Carson Investment Research
One possible reason the stock market is often weak in September is that it’s when investors return from their summer vacations and get back to work. They often sell stocks they no longer want to “clean up” their investments and make changes for tax purposes before the end of the year.
The Week Ahead
Investors are paying very close attention to the U.S. jobs report that will be released this Friday. The report will give market participants a clue about how much the Fed might cut interest rates in the coming months.
However, if inflation remains a problem, the Fed may not be able to lower rates as much as market participants are hoping.
Market participants will be watching the confirmation hearing for Stephen Miran, who is the President’s choice for a temporary position at the Fed. This is significant because it’s happening at a time when the President is increasing his public attacks on the Fed. He has been constantly criticizing the Fed’s chairman, Jerome Powell, for not cutting interest rates and is also trying to get another member, Lisa Cook, removed from her position.
Markets have been concerned about Fed independence and this remains a key topic of discussion which could have an impact on sentiment.

For all market-moving economic releases and events, see the MarketPulse Economic Calendar. (click to enlarge)
Technical Analysis – Dow Jones Index
From a technical standpoint, the Dow Jones index saw whipsaw price action on Tuesday with the index down as much as 1% before recovering in the second half of the day to finish the day down 0.57%.
Looking at the four-hour chart below, the Dow has seen a change in structure as it printed a lower low.
Price is however stuck now between the 50 and 100-day MAs which rests at 45508 and 45195 respectively.
A break below the 100-day MA could open up the possibility of a retest of the 200-day MA at 44880 with the next key support area resting at 44118.
Dow Jones Four-Hour Chart, September 2, 2025
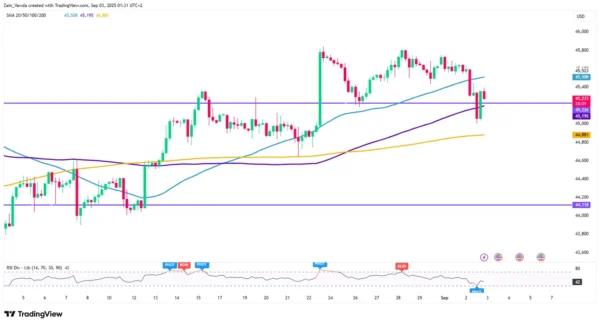
Source: TradingView (click to enlarge)
Client Sentiment Data – DOW JONES Index
Looking at OANDA client sentiment data and market participants are short on the DOW with 77% of traders net-short. I prefer to take a contrarian view toward crowd sentiment and thus the fact that so many traders are short means the Dow Jones Index could rise in the near-term.