

Bitcoin (BTC/USD) is still consolidating below the key 120k level but a triangle breakout may lead to fresh all-time highs.
The world’s largest cryptocurrency has broken above the triangle pattern on the H4 chart which could be the start of the next leg to the upside.
Bitcoin did break below the 50 neutral level on the RSI period 14 yesterday before breaking back above immediately which could be a sign that momentum remains with the bulls.
Looking for potential targets following a triangle breakout, traders typically use a simple method to set a price target:
- Measure the Base: Find the widest part of the triangle. This is the vertical distance between the highest and lowest points at the beginning of the triangle formation.
- Project from Breakout:
-
- For an upside breakout (price breaks above the top trendline): Take the measured height of the triangle’s base and add it to the price level where the breakout occurred.
- For a downside breakout (price breaks below the bottom trendline): Take the measured height of the triangle’s base and subtract it from the price level where the breakout occurred.
This projected price is your potential target. It’s important to also look for increased trading volume to confirm the breakout and consider placing a stop-loss order to manage risk in case of a false breakout.
With this in mind, a potential target rests around the 126200 handle.
Bitcoin (BTC/USD) Daily Chart, July 22, 2025
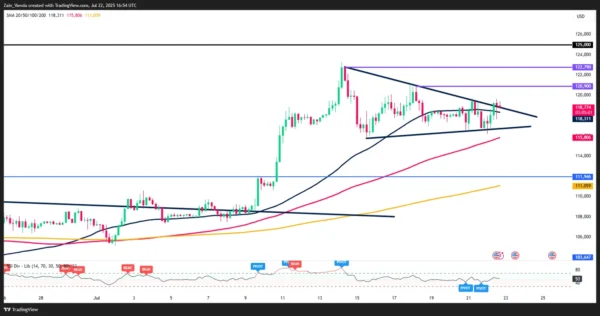
Source: TradingView.com (click to enlarge)
Bitcoin ETF Breaks 12-Day Inflow Streak
The only concern at present may come from spot Bitcoin ETFS, which saw 131.35 million in outflows on Monday. This brought a 12-day inflow streak to an end which brought in as much as $6.6 billion.
The biggest outflow came from ARK Invest’s ARKB, which lost $77.46 million in one day. Grayscale’s GBTC followed with $36.75 million in outflows, and Fidelity’s FBTC saw $12.75 million withdrawn, according to SoSoValue.
Bitwise’s BITB and VanEck’s HODL had smaller outflows of $1.91 million and $2.48 million. BlackRock’s IBIT, the largest fund with $86.16 billion in assets, had no changes in inflows or outflows.
Despite these outflows, total net inflows remain strong at $54.62 billion, and all spot Bitcoin ETFs combined hold $151.60 billion in assets, making up 6.52% of Bitcoin’s total market value.
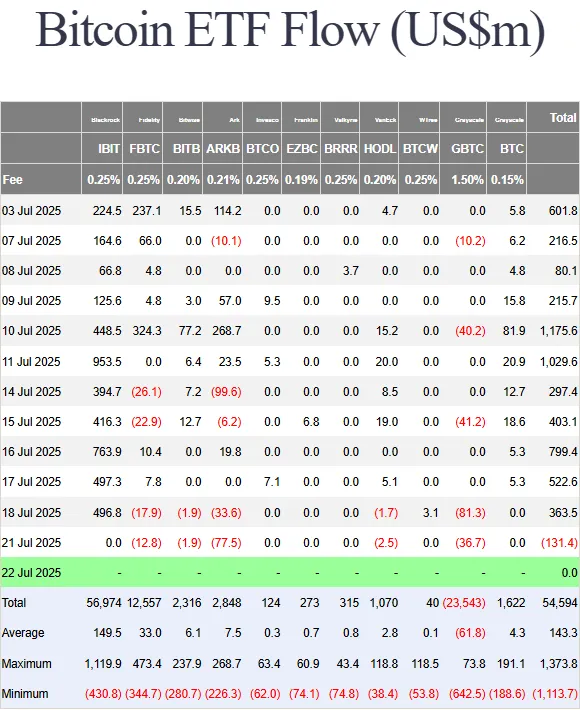
Source: Farside Investors
If outflows do continue then this could hinder a potential rally toward the 126200 area. Another factor to consider could be potential profit taking and rebalancing by institutions following the recent all-time highs.
Client Sentiment Data – Bitcoin (BTC/USD)
Looking at OANDA client sentiment data, the majority of traders are long on Bitcoin with 97% of traders net-long. I prefer to take a contrarian view toward crowd sentiment, thus the fact that 97% of traders are net-long suggests a deeper pullback may be in play in the near-term.