

The price actions of Gold (XAU/USD) have staged the expected bullish move, rallied by 2.3% and hit the US$3,435 resistance as highlighted in our earlier publication last Friday, 29 August.
The price actions of Gold (XAU/USD) have staged the expected bullish move, rallied by 2.3% and hit the US$3,435 resistance as highlighted in our earlier publication last Friday, 29 August.
For a quick recap, the US$3,435 is considered a significant range resistance on Gold (XAU/USD) as this level has managed to stall prior rallies since its current all-time high of US$3,500 printed on 22 April 2025 and caused Gold (XAU/USD) to oscillate in a choppy sideways range in the past four months.
Gold (XAU/USD) has finally managed to have a proper bullish breakout above the four-month range resistance of US$3,435 in last Friday’s US session, as it recorded a daily close of US$3,447 on 29 August in light of an anticipation of a US Federal Reserve’s dovish pivot in September.
Gold (XAU/USD) extended its upward momentum at the start of the week, advancing 0.8% to close at US$3,476 on Monday, 1 September.
In this latest report, we will highlight several key technical elements that Gold (XAU/USD) has entered into a potential short to medium-term bullish acceleration phase.
Let’s discuss them in detail, as well as the next short-term directional bias and key levels to watch on Gold (XAU/USD)
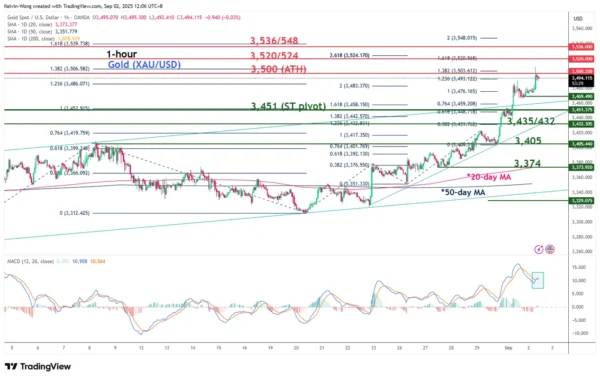
Fig. 1: Gold (XAU/USD) minor trend as of 2 Sep 2025 (Source: TradingView)
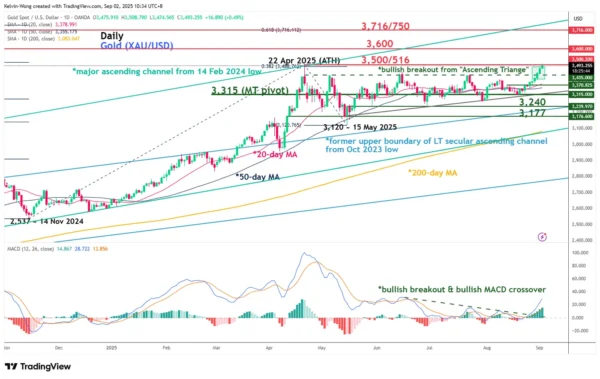
Fig. 2: Gold (XAU/USD) medium-term trend as of 2 Sep 2025 (Source: TradingView)
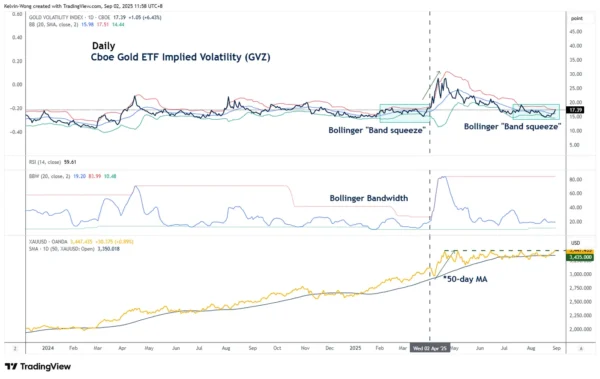
Fig. 3: Gold (XAU/USD) with GVZ (implied volatility of Gold ETF) as of 2 Sep2025 (Source: TradingView)
Preferred trend bias (1-3 days)
Maintain bullish bias on Gold (XAU/USD) as the yellow metal kickstarts a potential bullish acceleration phase (see Fig. 1).
Watch the US$3,451 key short-term pivotal support. A clearance above US$3,500 (the current all-time high) will see the next intermediate resistances coming in at US$3,520/3,524 and US$3,536/3,548 (Fibonacci extension clusters).
Key elements
- The hourly MACD trend indicator of Gold (XAU/USD) has just flashed out an impending bullish crossover signal above its centreline, which suggests that short-term bullish momentum remains intact (see Fig. 1).
- The recent bullish breakout in the Gold (XAU/USD) above US$3,435 marks an exit from a bullish continuation range configuration, defined as a bullish “Ascending Triangle”. These observations increase the odds of a continuation of its prior impulsive up move sequence (see Fig. 2).
- The daily MACD trend indicator of Gold (XAU/USD) has continued to trend upwards above its centreline after its earlier bullish crossover on Monday, August 25, 2025, which supports a potential change in medium-term trend conditions from sideways to bullish (see Fig. 2).
- The Cboe Gold exchange-traded fund implied volatility (GVZ) has entered into a low volatility environment, as depicted by the narrowing of the Bollinger Bands, called the “Band Squeeze” since mid-July 2025. A “Band Squeeze” or a low “Bandwidth” reading is a prelude to a potential expansion in volatility. An increased implied volatility (GVZ) may trigger a significant up move in Gold (XAU/USD) (see Fig. 3).
- Recent observations between February and March 2025, when a Bollinger “Band Squeeze” in GVZ occurred, preceded a notable rally in Gold (XAU/USD) in April 2025 (see Fig. 3).
Alternative trend bias (1 to 3 days)
Failure to hold at the US$3,451 key short-term support on Gold (XAU/USD) negates the bullish tone for another round of minor corrective decline to retest US$3,435/3,432 pull-back support of the former medium-term “Ascending Triangle” range resistance.