

Key Highlights
- Ethereum gained over 25% and broke the $4,150 resistance zone.
- ETH is now well above a connecting bullish trend line with support at $3,700 on the daily chart.
- Bitcoin price is consolidating gains below the $122,000 resistance.
- XRP is struggling to gain pace for a move above the $3.40 level.
Ethereum Technical Analysis
Ethereum started a major increase above the $3,500 and $3,800 resistance levels. ETH cleared the $4,000 barrier and outpaced Bitcoin.
Looking at the daily chart, the price settled above the $3,800 level and the 100-day simple moving average (red). A high was formed at $4,347 and the price is now consolidating gains. On the downside, Ethereum might find support near the $4,100 level.
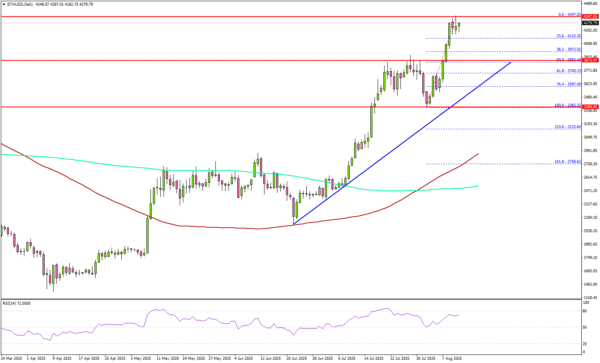
The next major support is $3,880 or the 50% Fib retracement level of the upward move from the $3,365 swing low to the $4,347 high, below which the price could slide toward $3,700.
There is also a connecting bullish trend line forming with support at $3,700 on the same chart. Any more losses might call for a move toward the $3,600 level or the 76.4% Fib retracement level of the upward move from the $3,365 swing low to the $4,347 high.
On the upside, the price is facing hurdles near the $4,350 level. The next major resistance is near the $4,500 level. A daily close above the $4,500 resistance zone could start another steady increase. In the stated case, the price may perhaps rise toward the $4,800 level. The next stop for the bulls may perhaps be $5,000.
Looking at Bitcoin, there was a steady increase above the $118,000 level but the bulls struggled to keep the price above the $121,500 level.
Economic Releases
- US Consumer Price Index for July 2025 (MoM) – Forecast +0.2%, versus +0.3% previous.
- US Consumer Price Index for July 2025 (YoY) – Forecast +2.8%, versus +2.7% previous.
- US Consumer Price Index Ex Food & Energy for July 2025 (YoY) – Forecast +3.0%, versus +2.9% previous.