

After a rough month of July taking the most traded Major pair from 1.1830 highs to a 4-handle correction, the NFP report at the beginning of the month led a huge wave of higher mean-reversion – An end-July daily double top on the pair had brought fresh technical fuel to sell the Euro.
August 1st marked lows at 1.13915, with oversold daily levels and an over-extended US Dollar created a perfect recipe for consequential dip buying in EURUSD.
The pair is now trying to reach the 1.17 psychological level amid another fresh wave of US Dollar selling.
Positive data releases for the pair have worked towards bullish fundamentals, allowing fresh buying to take place.
This morning’s US CPI in line report saw further pricing of FED cuts for the September meeting – with the Eurozone main policy rate staying put at 2% for the past two meetings, Markets expect rate differentials between the Euro and the US Dollar to converge further.
Euro buyers seem to discard the miss in the Eurozone consumer sentiment as Markets put more emphasis on the Dollar weakness theme.
For those who haven’t seen, the mid-tier data release saw a weaker than expected 25.1 Eurozone ZEW Consumer sentiment vs 28.1 estimate.
Let’s now turn to the EURUSD technicals to spot if buyers have enough strength to break the 1.17 handle amid the broader USD weakness.
The current Daily picture for Forex Majors
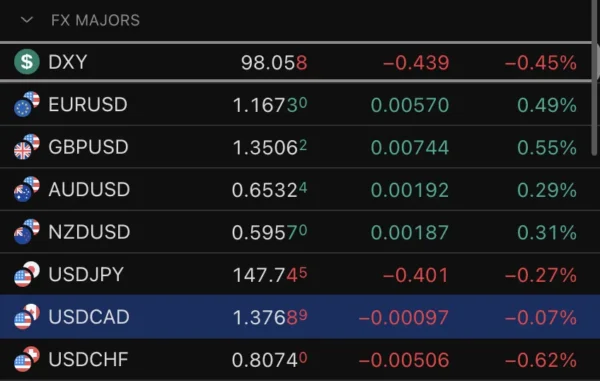
FX Major Watchlist, August 12, 2025 – Source: TradingView
There has been some heavy selling in the US Dollar after the data release, leading to most major currencies appreciate except for the Loonie getting dragged down.
The Dollar index touched 97.90 lows and has now weakly reverted above 98.00. A failure to retest higher levels points to further USD weakness (for the time being at least)
EURUSD Daily Chart
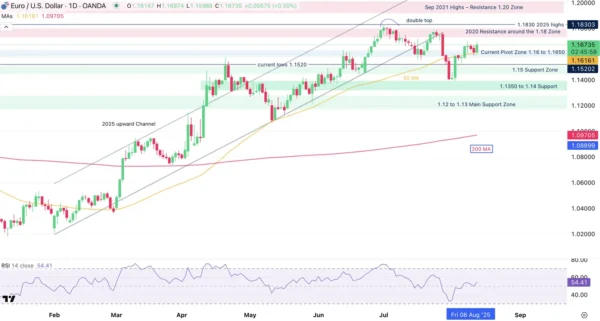
EURUSD Daily Chart, August 12, 2025 – Source: TradingView
The pair is up close to 0.50% on the session, with the morning daily candle trying to break out of a multi-day consolidation.
Buyers stepped in at the 50-Day MA to bring EURUSD to current levels. This moving average, currently standing at 1.16160 is a key barometer for bull/bear strength.
RSI Momentum is back above neutral and turning higher, however more work needs to be done for bulls to push the pair higher.
Let’s analyze shorter timeframes to see why.
EURUSD 4H Chart

EURUSD 4H Chart, August 12, 2025 – Source: TradingView
As long as buyers don’t break the intermediate highs (1.16990), the momentum is more rangebound than upward trending.
Despite this morning’s push using the 50-period MA as support, the 4H MA-200 is flattening indicating indecision – This technical formation also coincides with the few overlapping bull and bear candles, generally indicating rangebound action.
Furthermore, this morning’s highs are forming a shorter timeframe double-top on the currency pair.
EURUSD would need a further boost from USD selling to push above 1.17 – Above 1.17 however, there isn’t much resistance before the 2025 highs 1.18 Zone.
EUR/USD Levels to keep on your charts:
Resistance Levels
- 1.17 psychological level (coincides with daily highs)
- 1.1760 to 1.18 2025 highs resistance zone
- 1.1830 2025 top
Support Levels
- Current Pivot Zone 1.16 to 1.1650
- 1.15 Psychological Level
- 1.1350 to 1.14 Support 2
EURUSD 1H Chart
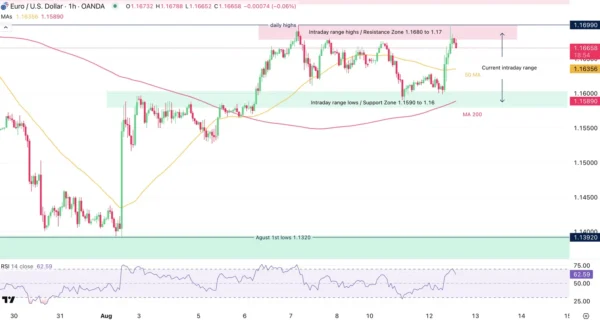
EURUSD 1H Chart, August 12, 2025 – Source: TradingView
Looking even closer to the hourly charts, we see how well defined the intraday range is between the 1.1590 to 1.16 range lows and the 1.1680 to 1.17 range highs.
Look for breakouts both ways to mark new momentum, however, the action looks more rangebound in the immediate picture.
Safe Trades!